SPARQLGPViz contributed to KGLab
Last week our work on visualizing SPARQL graph pattern found a place in another open source project: kglab, a python package for graph-based data science[1]. kglab itself is an abstraction layer of various libraries oriented around data science dealing with graph-based data structure: semantic graph (RDF), probabilistic graph, graph machine learning, etc.
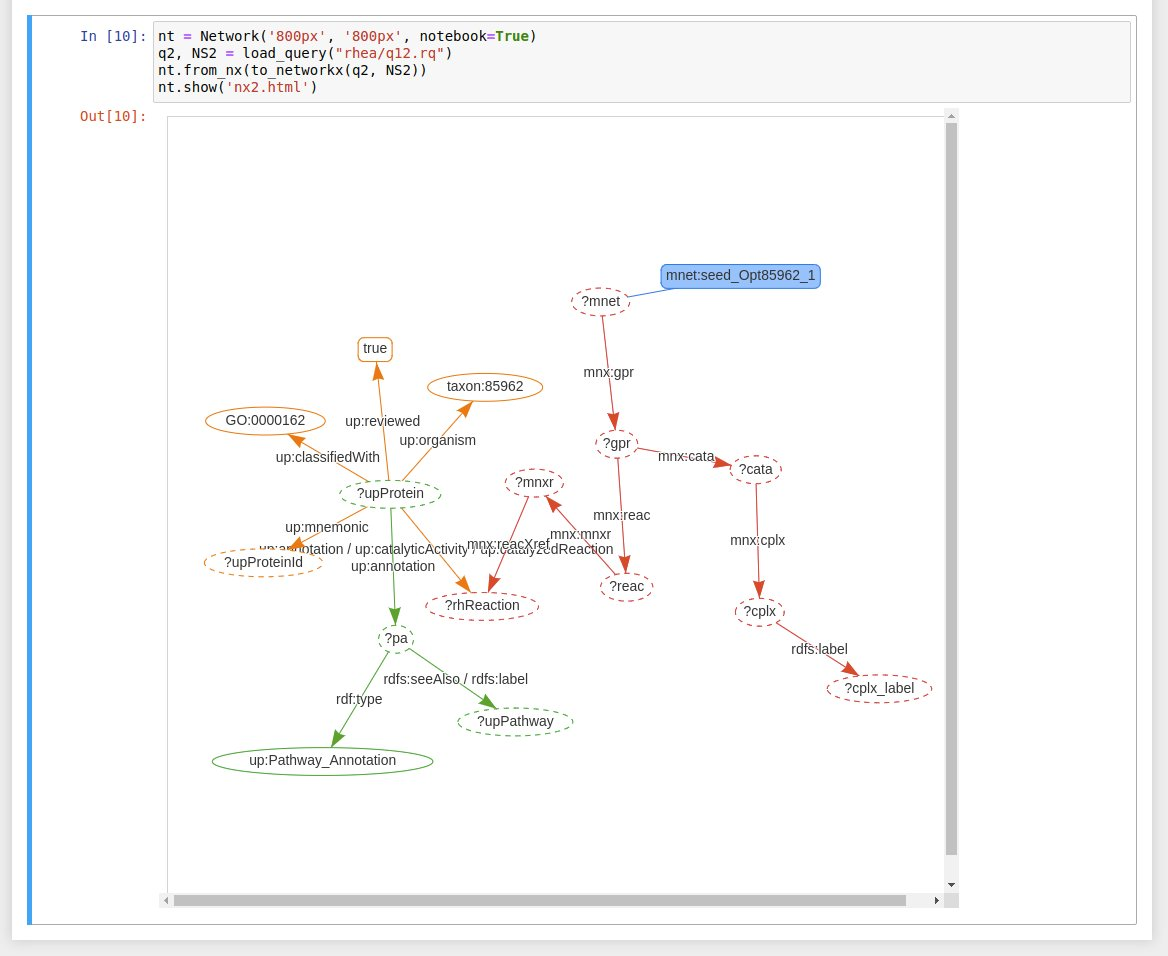
What’s new from this integration of sparqlgpviz in kglab is now you can have the visualization of SPARQL graph pattern inside a jupyter notebook. See some examples below:
At the moment, there is some flavor to how the code is implemented. The original one that works as a command-line program still depends on Graphviz. Additionally, there is a separate function to produce a networkx graph object without any dependency on Graphviz. In the code base of kglab, the visualization algorithm is rewritten further so it can directly use pyvis without having networkx as an intermediate representation.
[1] https://derwen.ai/s/kcgh